Values at points: which method did you use?
The question: sampling a raster at points is one of the most common jobs there is, and most people use whatever their tool does by default. uw-cryo/raster_sampling puts it bluntly: people default to rasterio’s sample (the nearest cell) “without considering consequences”, and there is no intercomparison of the options. In R, bilinear extraction comes up again and again, for example terra #29 (slopes along roads) and this r-bloggers post.
What wxylib does: wxy points reads a GeoTIFF or Zarr array at points given on stdin. -r near returns the cell the point falls in, as gdallocationinfo does. -r bilinear, cubic and cubicspline interpolate as GDAL’s InterpolateAtPoint does, and match it exactly in the fixtures. The reads are planned first, so each chunk is fetched once however many points fall in it (see the explainer).
The run
run.py puts 400 points on an 8 km line from Hobart’s waterfront to the summit of kunanyi / Mount Wellington and reads the Copernicus 30 m DEM three ways:
wxy points dem.tif -r near     < line.csv
wxy points dem.tif -r bilinear < line.csv
wxy points dem.tif -r cubic    < line.csv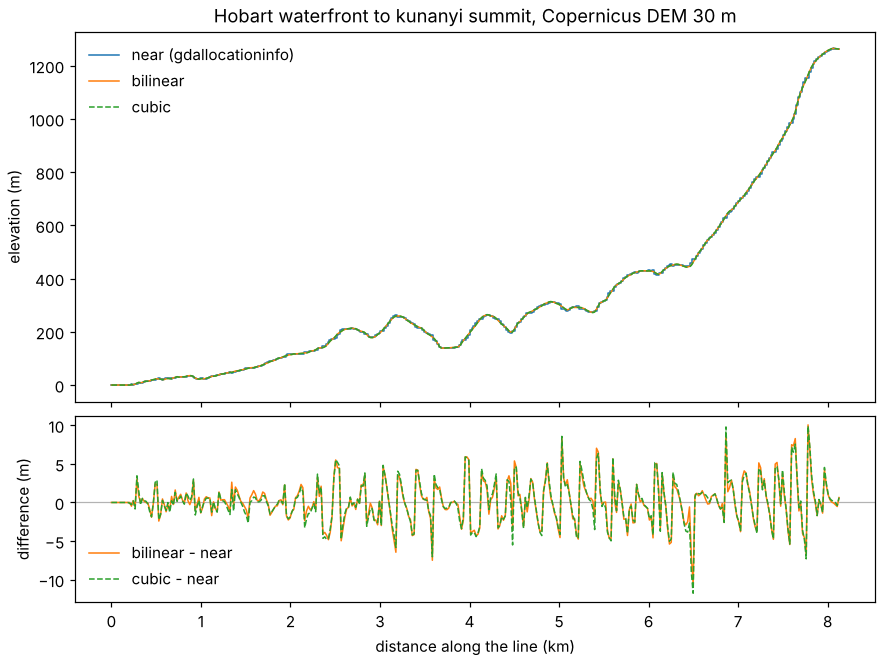
On this slope, bilinear and cubic differ from the nearest cell by 2 m on average and by up to 11 or 12 m. The nearest-cell profile is a staircase, with one step for each 30 m cell. Bilinear and cubic agree with each other to within about 2 m (0.3 m on average).
With --dry-run, the same command prints its plan and reads nothing: 2 of the tile’s 16 chunks, 2.3 MB stored (8.4 MB decoded). Those are the only tiles a run reads.
Limits
- The CLI reads local files only. The plan is ready for remote ones (the same planning runs in the browser demo), but opening a URL from the command line is still to come.
- Points on a curvilinear (2D lon/lat) Zarr source work the same way (see the curvilinear vignette), which is the job Herbie’s pick_points does for weather model grids with a BallTree.